10x Visium Discovery Hub
空間生物学が持つ力を探る
ホルマリン固定パラフィン包埋組織サンプルに関して10x Genomicsが生成したVisiumデータセットにアクセスし、空間解析生物学が持つ力を経験してください。下に表示した器官名をクリックすると、その器官のデータアトラスが表示されます。
Select your organ of interest
Select an organ below to view the Spatial Gene Expression Dataset
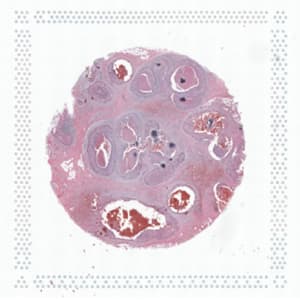
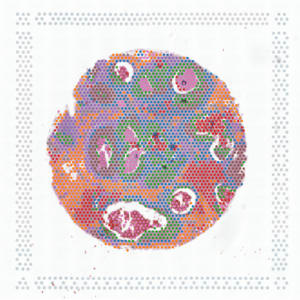
Human Breast Cancer
5 µm section from Ductal Carcinoma In Situ, Invasive Carcinoma
- Species
- Human
- Genes Detected
- 17651
- Capture Area
- 6.5 x 6.5 mm
- Spots Under Tissue
- 2518
- Chemistry
- Visium FFPE
- Mean Reads per Spot
- 32524
- Mean UMI Counts per Spot
- 14442
- Median Genes per Spot
- 5244
Spatial Gene Expression
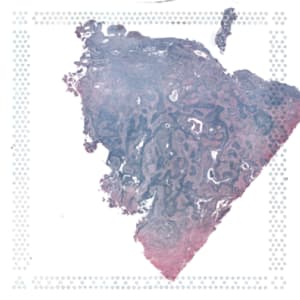
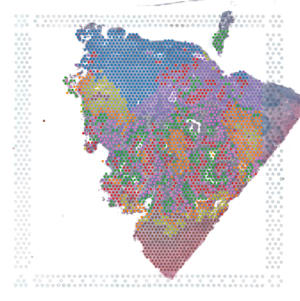
Human Cervical Cancer
5 µm section from squamous cell carcinoma
- Species
- Human
- Genes Detected
- 17871
- Capture Area
- 6.5 x 6.5 mm
- Spots Under Tissue
- 2781
- Chemistry
- Visium FFPE
- Mean Reads per Spot
- 73046
- Mean UMI Counts per Spot
- 26050
- Median Genes per Spot
- 7276
Spatial Gene Expression
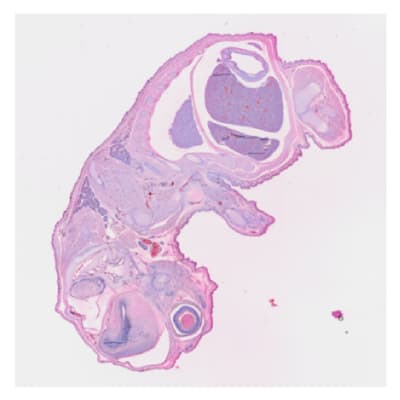
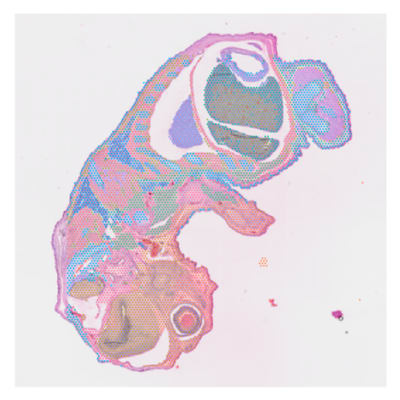
Mouse Melanoma
5 µm section of Mouse Embryo
- Species
- Mouse
- Genes Detected
- 19404
- Capture Area
- 11 x 11 mm
- Spots Under Tissue
- 6443
- Chemistry
- CytAssist for FFPE
- Mean Reads per Spot
- 129162
- Mean UMI Counts per Spot
- 62780
- Median Genes per Spot
- 8843
Spatial Gene Expression
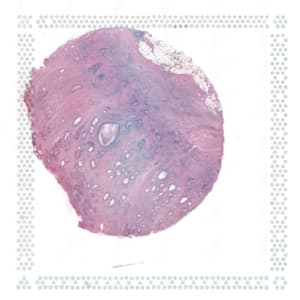
Human Intestine Cancer
5 µm section from Human Intestinal Colorectal Cancer
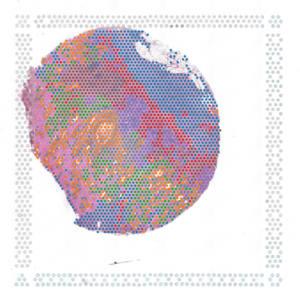
- Species
- Human
- Genes Detected
- 17579
- Capture Area
- 6.5 x 6.5 mm
- Spots Under Tissue
- 2660
- Chemistry
- Visium FFPE
- Mean Reads per Spot
- 77288
- Mean UMI Counts per Spot
- 25312
- Median Genes per Spot
- 7438
Spatial Gene Expression
Human Lung Cancer
5 µm section from Lung, Squamous Cell Carcinoma
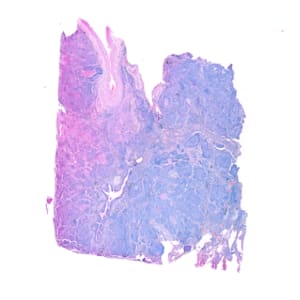
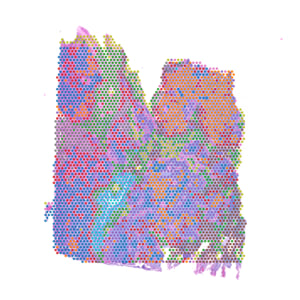
- Species
- Human
- Genes Detected
- 18066
- Capture Area
- 6.5 x 6.5 mm
- Spots Under Tissue
- 3858
- Chemistry
- CytAssist for FFPE
- Mean Reads per Spot
- 35785
- Mean UMI Counts per Spot
- 13991
- Median Genes per Spot
- 6174
Spatial Gene Expression
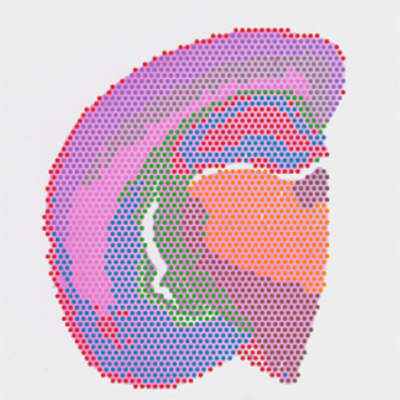
Mouse Brain
5 µm section of Mouse Brain
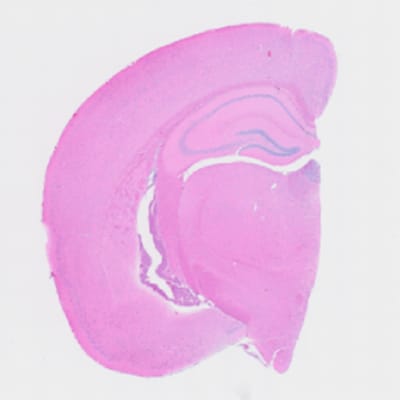
- Species
- Mouse
- Genes Detected
- 19352
- Capture Area
- 6.5 x 6.5 mm
- Spots Under Tissue
- 2310
- Chemistry
- CytAssist for FFPE
- Mean Reads per Spot
- 53497
- Mean UMI Counts per Spot
- 24862
- Median Genes per Spot
- 6736
Spatial Gene Expression
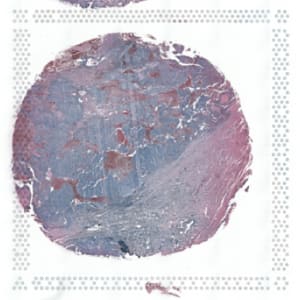
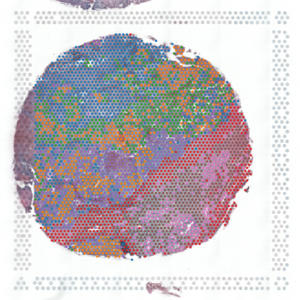
Human Ovarian Cancer
5 µm section from serous papillary carcinoma of human ovarian
- Species
- Human
- Genes Detected
- 17294
- Capture Area
- 6.5 x 6.5 mm
- Spots Under Tissue
- 3455
- Chemistry
- Visium FFPE
- Mean Reads per Spot
- 63836
- Mean UMI Counts per Spot
- 28927
- Median Genes per Spot
- 7621
Spatial Gene Expression
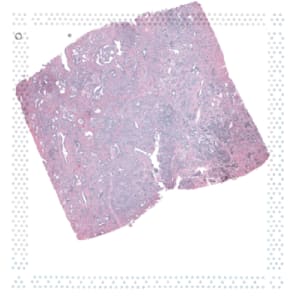
Human Prostate Cancer
5 µm section from Invasive Acinar Cell Carcinoma, Stage IV, Gleason score- 7
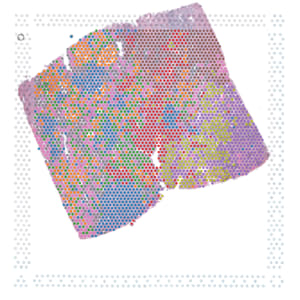
- Species
- Human
- Genes Detected
- 16907
- Capture Area
- 6.5 x 6.5 mm
- Spots Under Tissue
- 4371
- Chemistry
- Visium FFPE
- Mean Reads per Spot
- 23087
- Mean UMI Counts per Spot
- 13991
- Median Genes per Spot
- 5391
Spatial Gene Expression
Human Melanoma
5 µm section from Skin, Malignant Melanoma
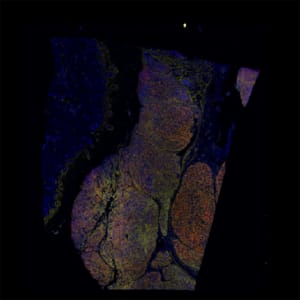
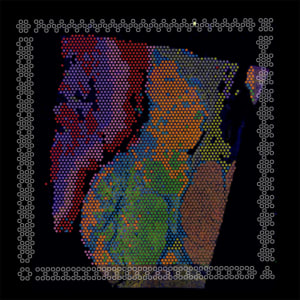
- Species
- Human
- Genes Detected
- 18069
- Capture Area
- 6.5 x 6.5 mm
- Spots Under Tissue
- 3458
- Chemistry
- Visium CytAssist for FFPE
- Mean Reads per Spot
- 55952
- Mean UMI Counts per Spot
- 27894
- Median Genes per Spot
- 7598
Spatial Gene Expression
がん研究のための空間ツール
腫瘍微小環境(TME)は、最もエキゾチックな雨林と同じく多様かつ複雑であり、背景状況を考慮して研究する必要があります。組織学と空間的に解析した遺伝子発現情報とを組み合わせたVisiumデータにより、組織構造ががんの進行、免疫浸潤および治療効果に及ぼす影響について理解を深めることができます。
腫瘍学研究の向上に役立つリソース
10xで腫瘍の不均一性を解析
腎細胞癌の腫瘍微小環境の空間構成FFPEアプリケーション
FFPEサンプルからVisiumで得られた前立腺癌の主要なマーカーおよび細胞種に関する空間的遺伝子発現情報が、腫瘍微小環境の病理学的評価をどのように補完するかをご覧ください。ポスター
タンパク質と遺伝子発現の同時プロファイリングによるFFPE組織中の腫瘍微小環境のマルチオミクス特性解析
